
Concentrated Capital - Four year cycle pendulum is alive
Why I believe the four year cycle is intact, what are the long opportunities meanwhile and risks to the thesis I'm watching closely

Welcome to Concentrated Capital newsletter. I’m pausing weekly updates and experimenting with a new format - more in-depth research materials shared about once a month. Would love to engage with you in in-depth conversations, very open to debate about my thesis as I’m seeking the truth. I’m also opening the newsletter to the public so appreciate a lot your shares and some twitter love if you’re feeling like it.
Intro
Today we’re going to explore one critical theory about bitcoin price - the 4 year cycle where ~1.5y bear cycle is followed by a ~2.5 year bull run as for the fourth time the market seems to have topped right at the point of the end of the 4y cycle. As financial markets are supposed to be pricing in predictable and periodic behaviors, this theory has to stop working at some point and this cycle we’re seeing multiple different attempts to justify that “this time it’s going to be different” attributed to institutional adoption, longer cycle of business activity and diminishing effect of mining rewards.
History of 4y cycle theory
The theory is mainly attributed to the Bitcoin halving happening every 4 years and igniting the bullrun by reducing the system inflation rate in half. First halving happened in 2012 and was a significant 30% to 15% yearly inflation reduction. Second in 2016 cut 10% to 5%, third in 2020 to 2.5% and finally the last in 2024 to 1.25% inflation.
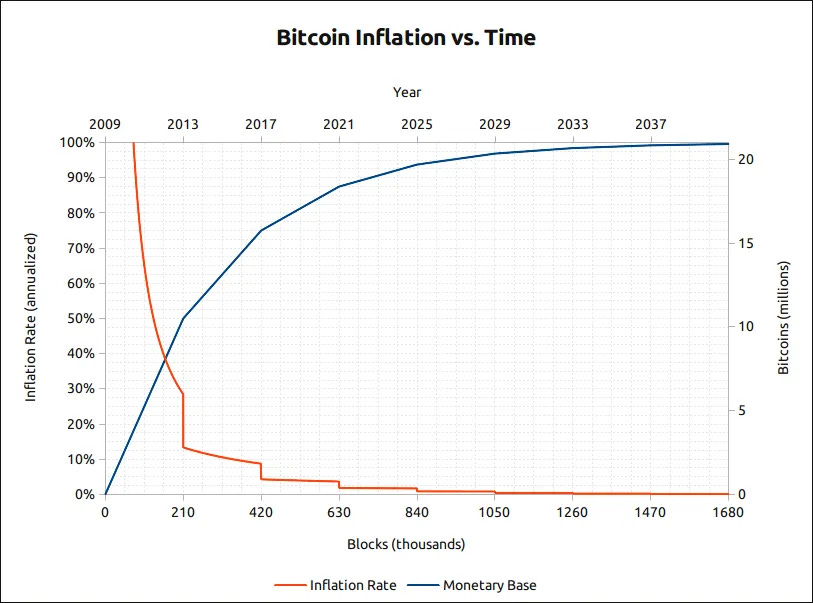
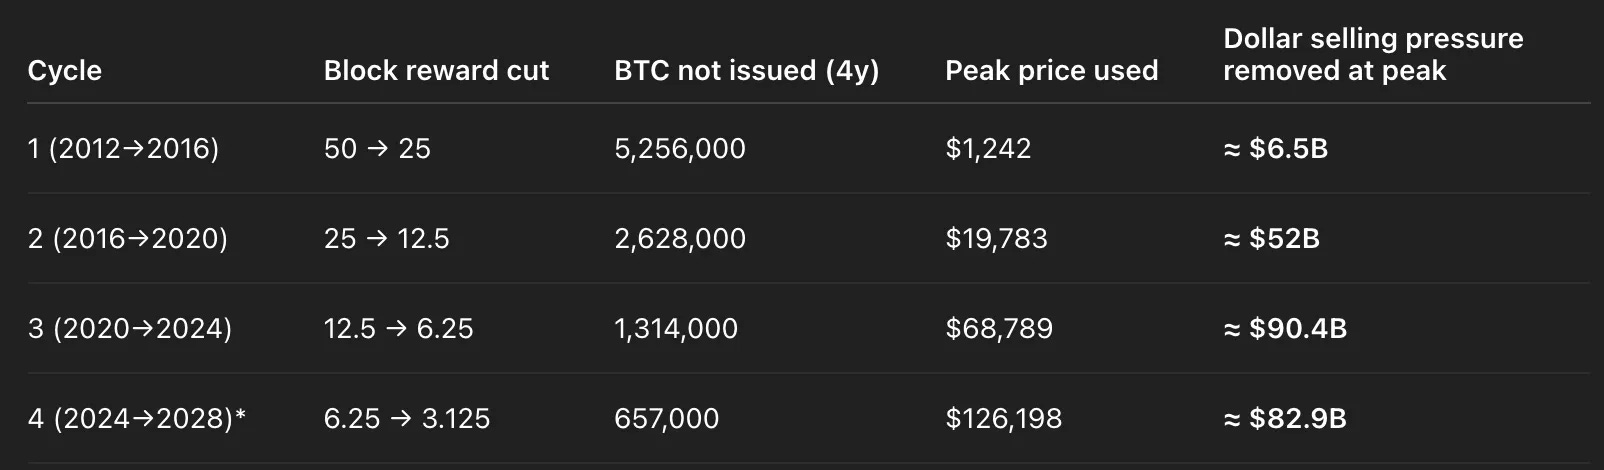
While the move from 2.5% to 1.25% inflation may sound insignificant it still amounts to $35-82B of selling pressure removed from the system depending on the price range during the entire 4y cycle. Which is comparable to the whole net inflows into Bitcoin ETF. Basic arithmetic says if Bitcoin price doubles in a cycle and reward is cut in half then dollar terms of “net inflows” = “removed net outflow” would stay the same. We’re seeing this hold so far as the price indeed tripled between second and third cycle and doubled between the next two.
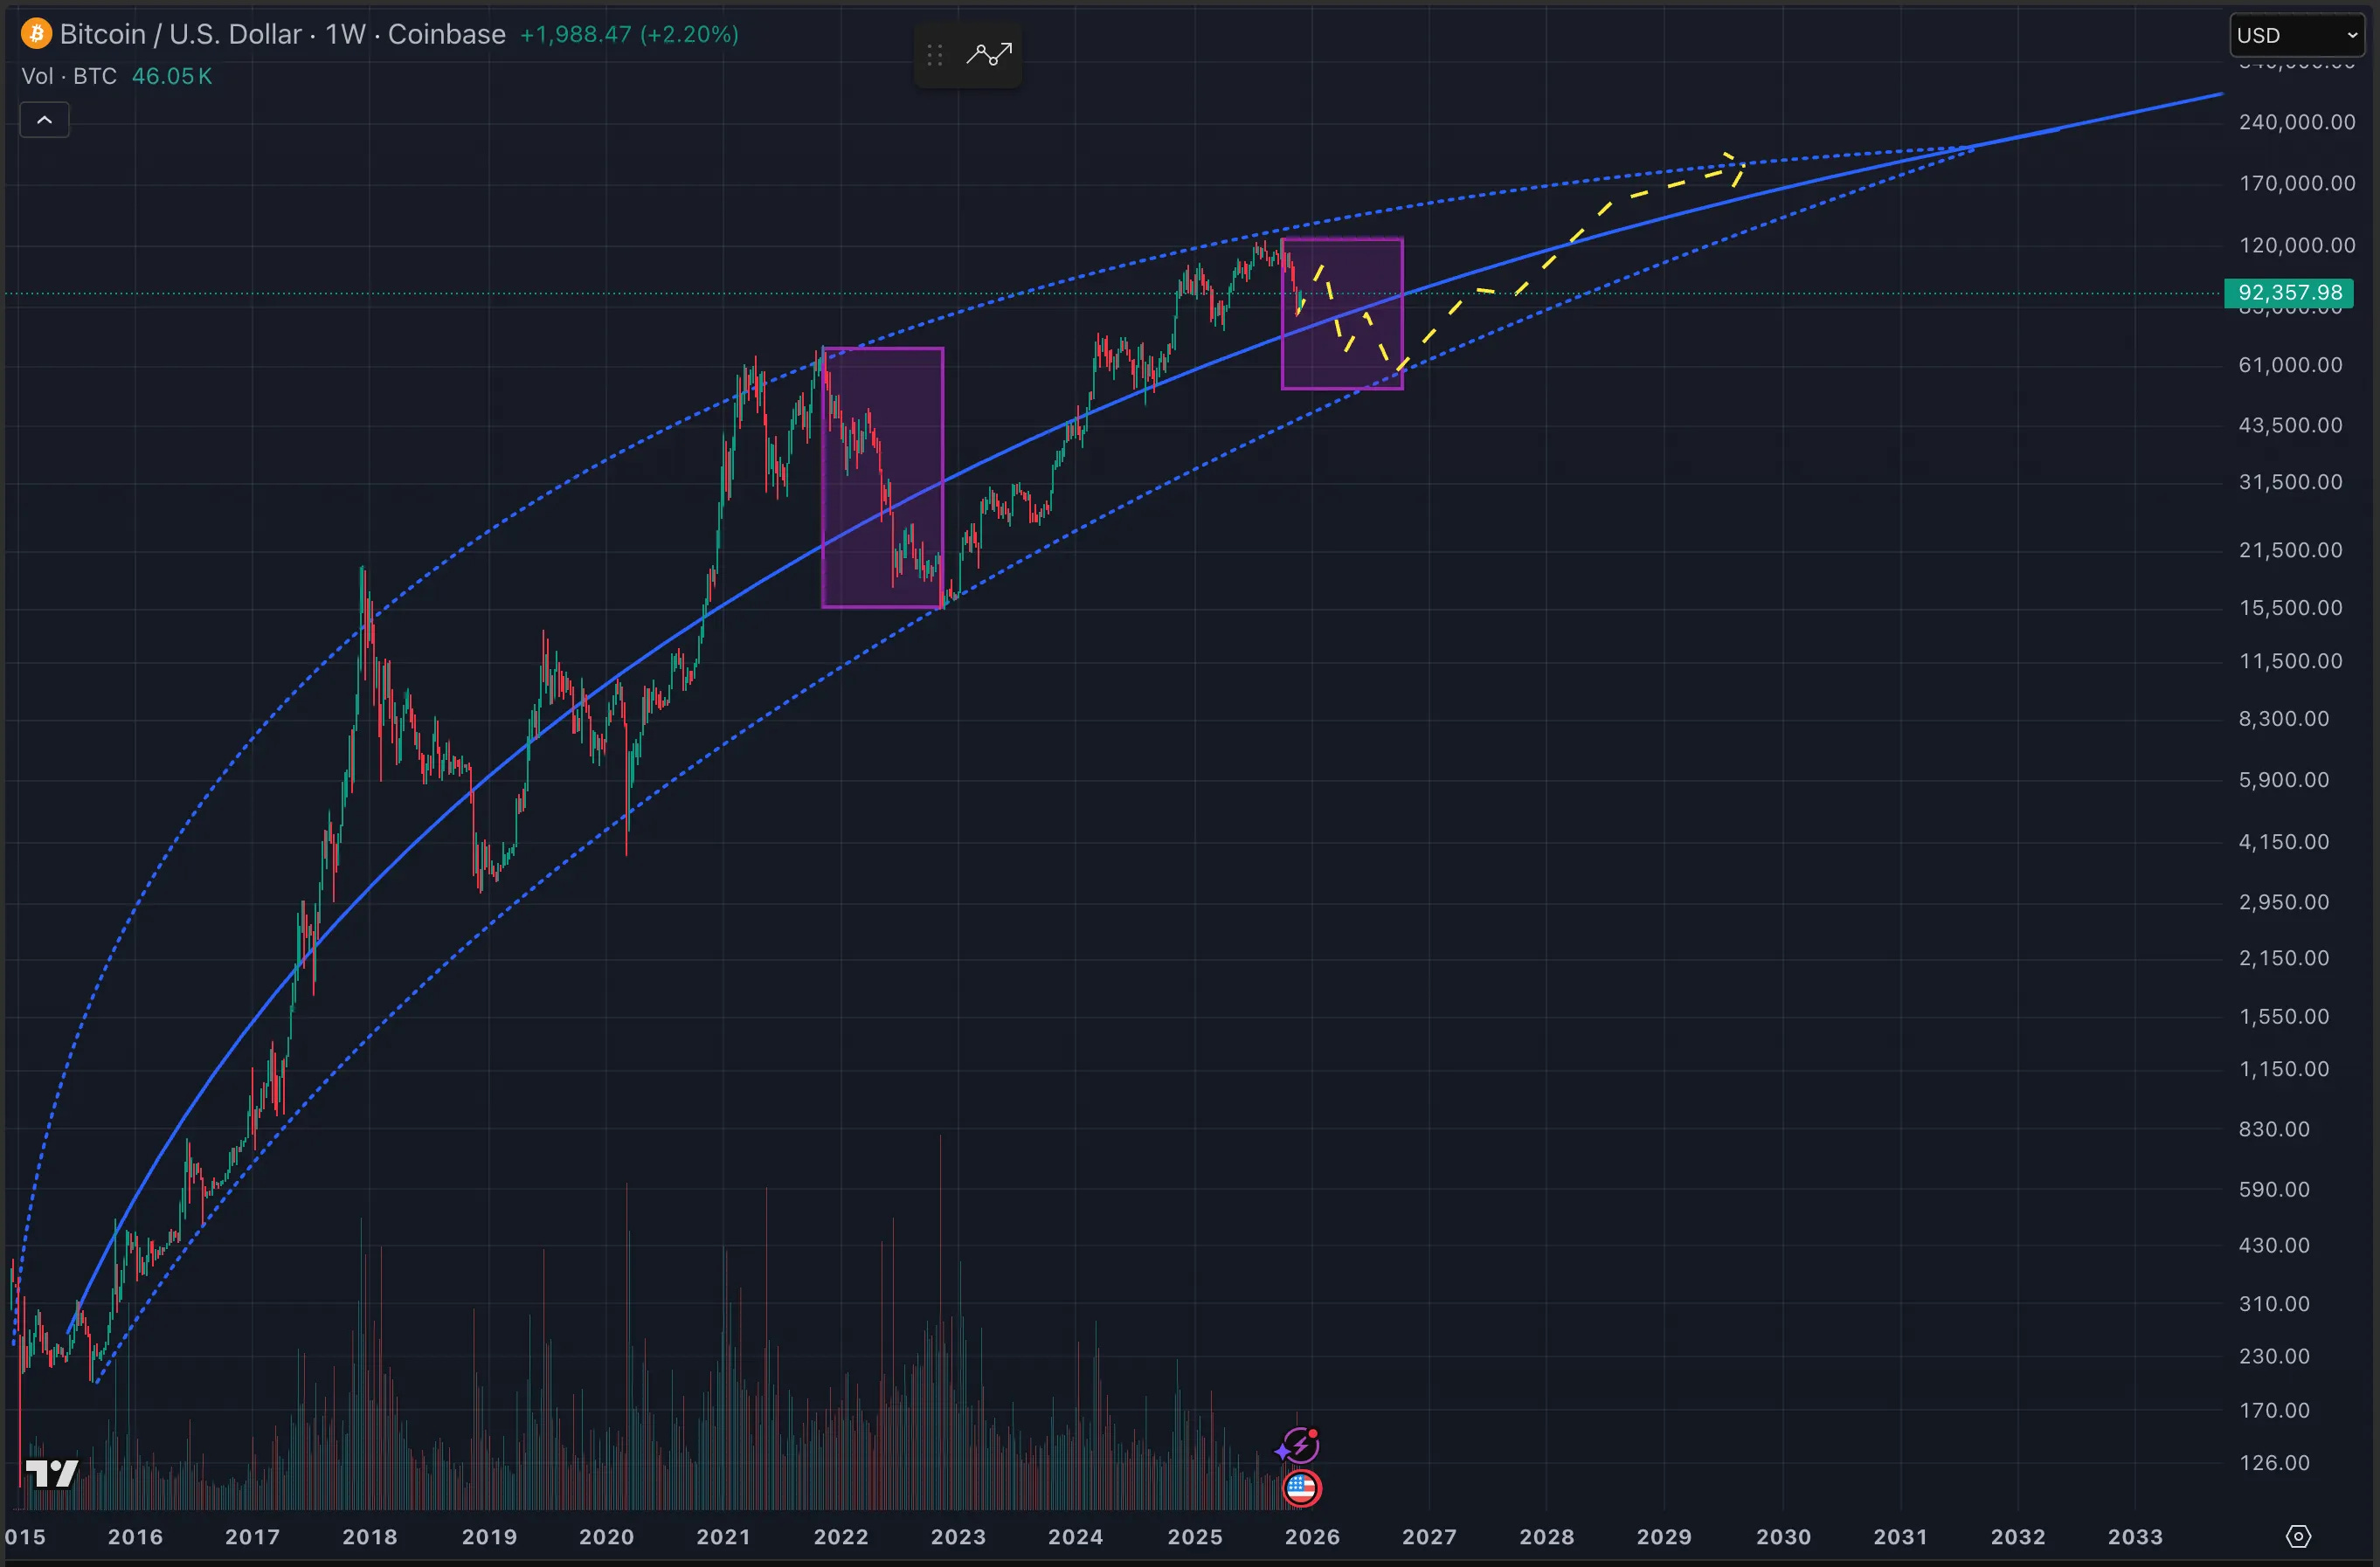
Now let’s examine the chart that made headlines in the early cycles of Bitcoin life called Rainbow Price. It explores the rainbow shape range between upper and lower bound on logarithmic scale of bitcoin price.
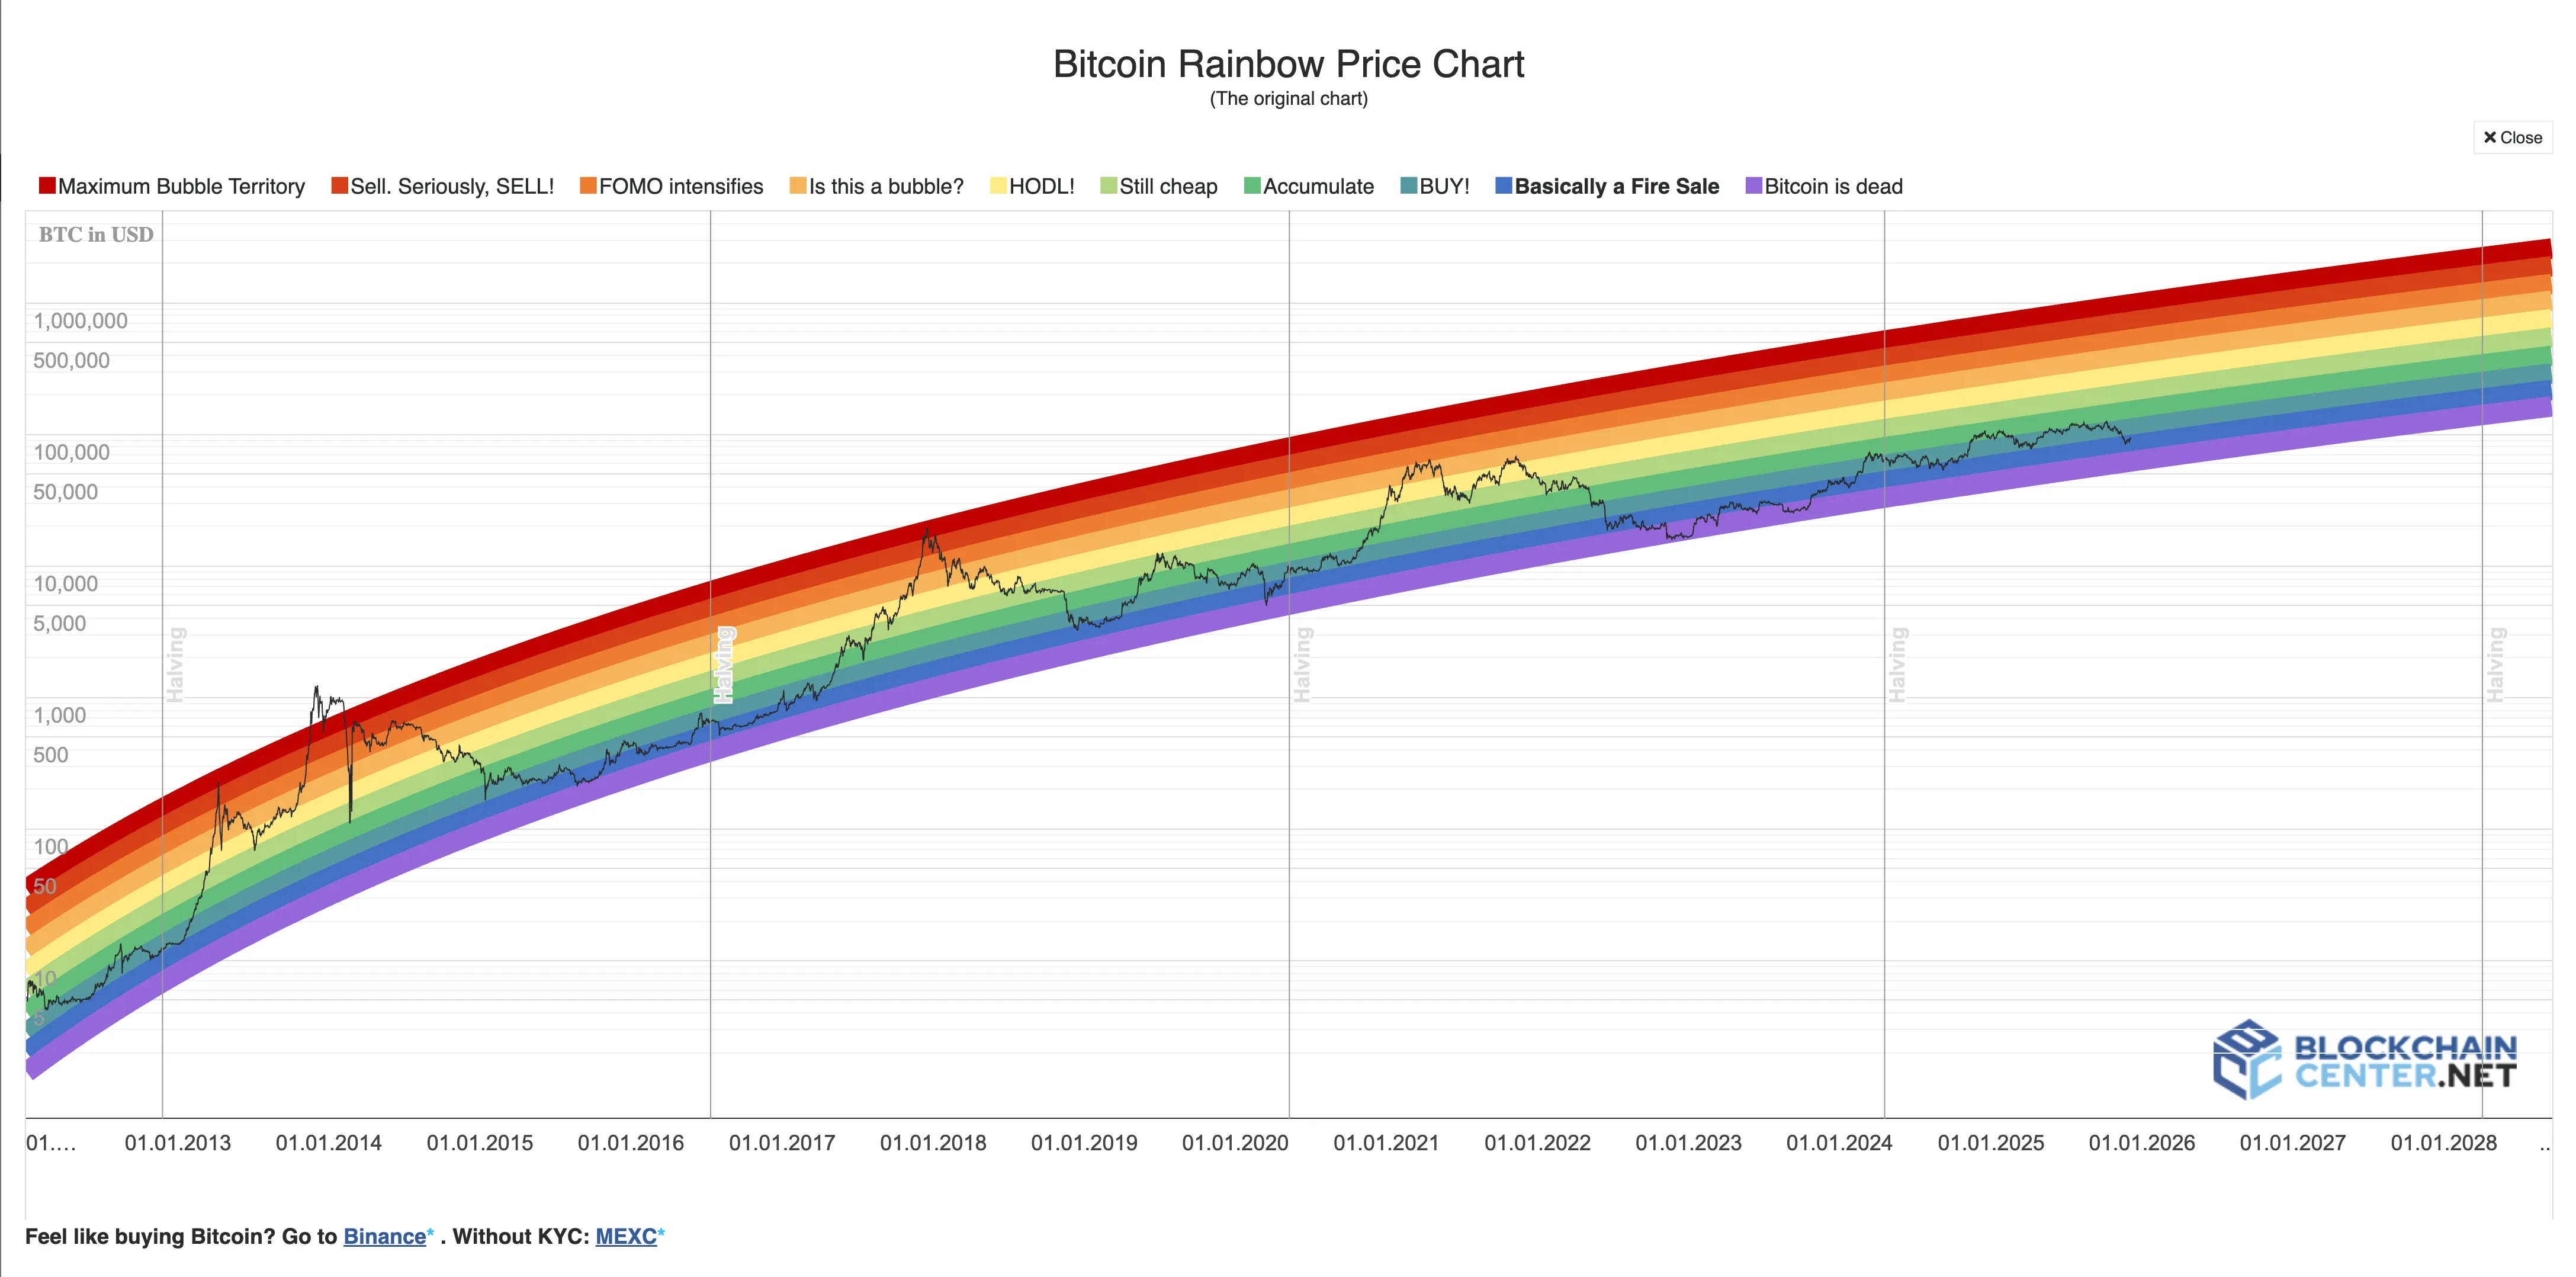
It’s obviously wrong on capturing the upper bound, but it’s surprisingly good at capturing the bottom one. The reason for the underperformance is relatively obvious - the range size is equal and assumes tops and bottoms are in equal distance from each other on a logarithmic scale! Meaning exponentially away from each other on a normal scale, while in reality we’re seeing the opposite. The market shows us clearly diminishing swings in terms of low to high multiples.
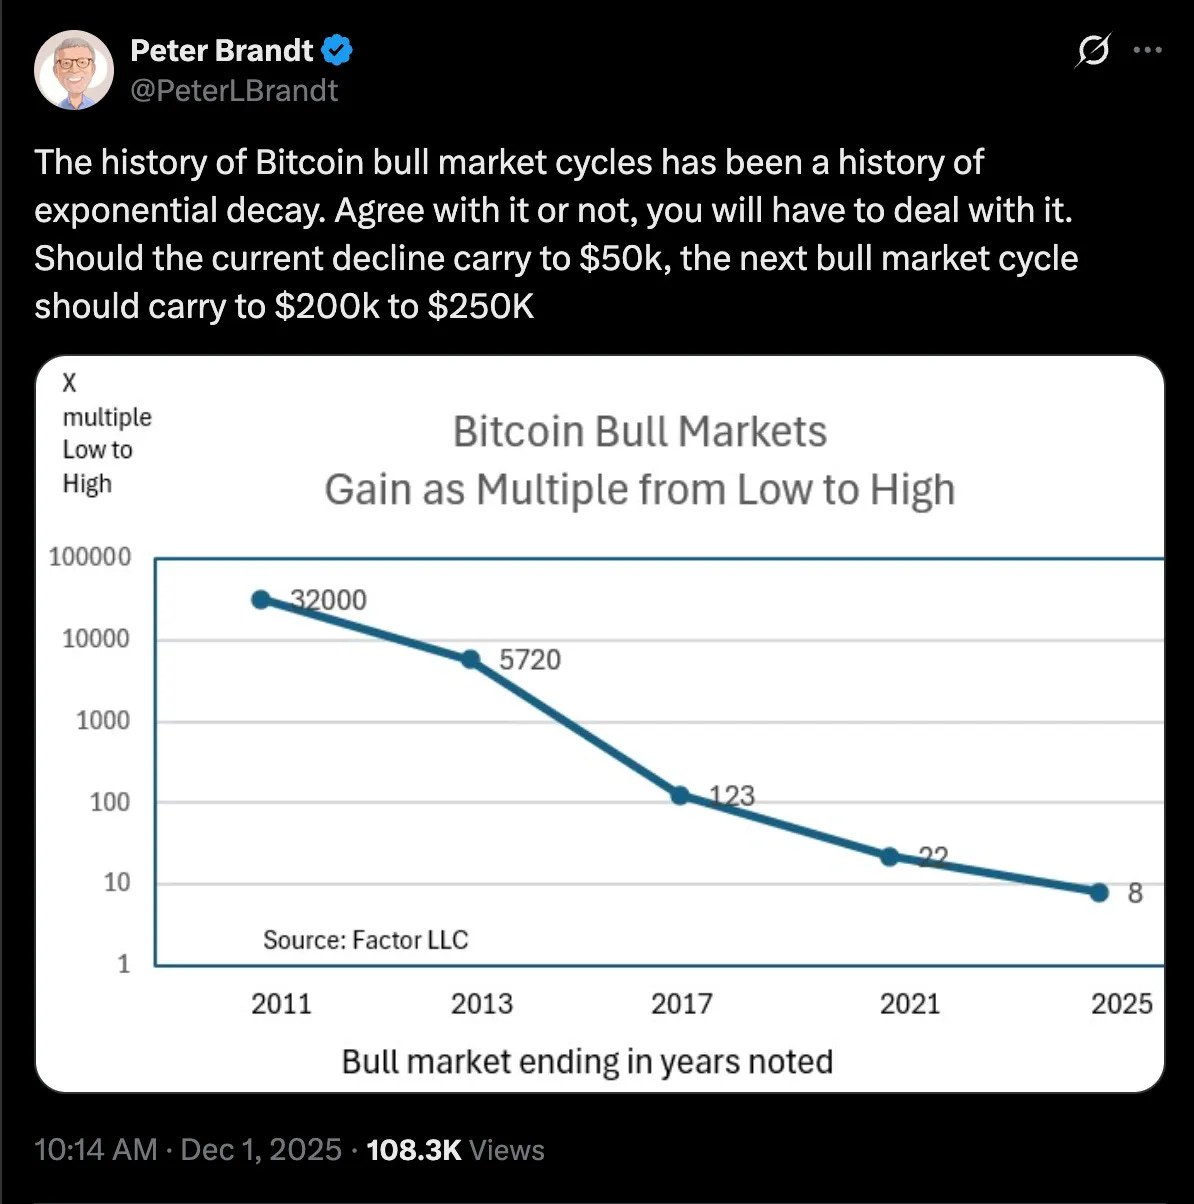
https://x.com/peterlbrandt/status/1995511746711470307?s=46
Which leads me to the following formula for a 4 year cycle.
Four year cycle as a decaying oscillation of an exponential Bitcoin price discovery
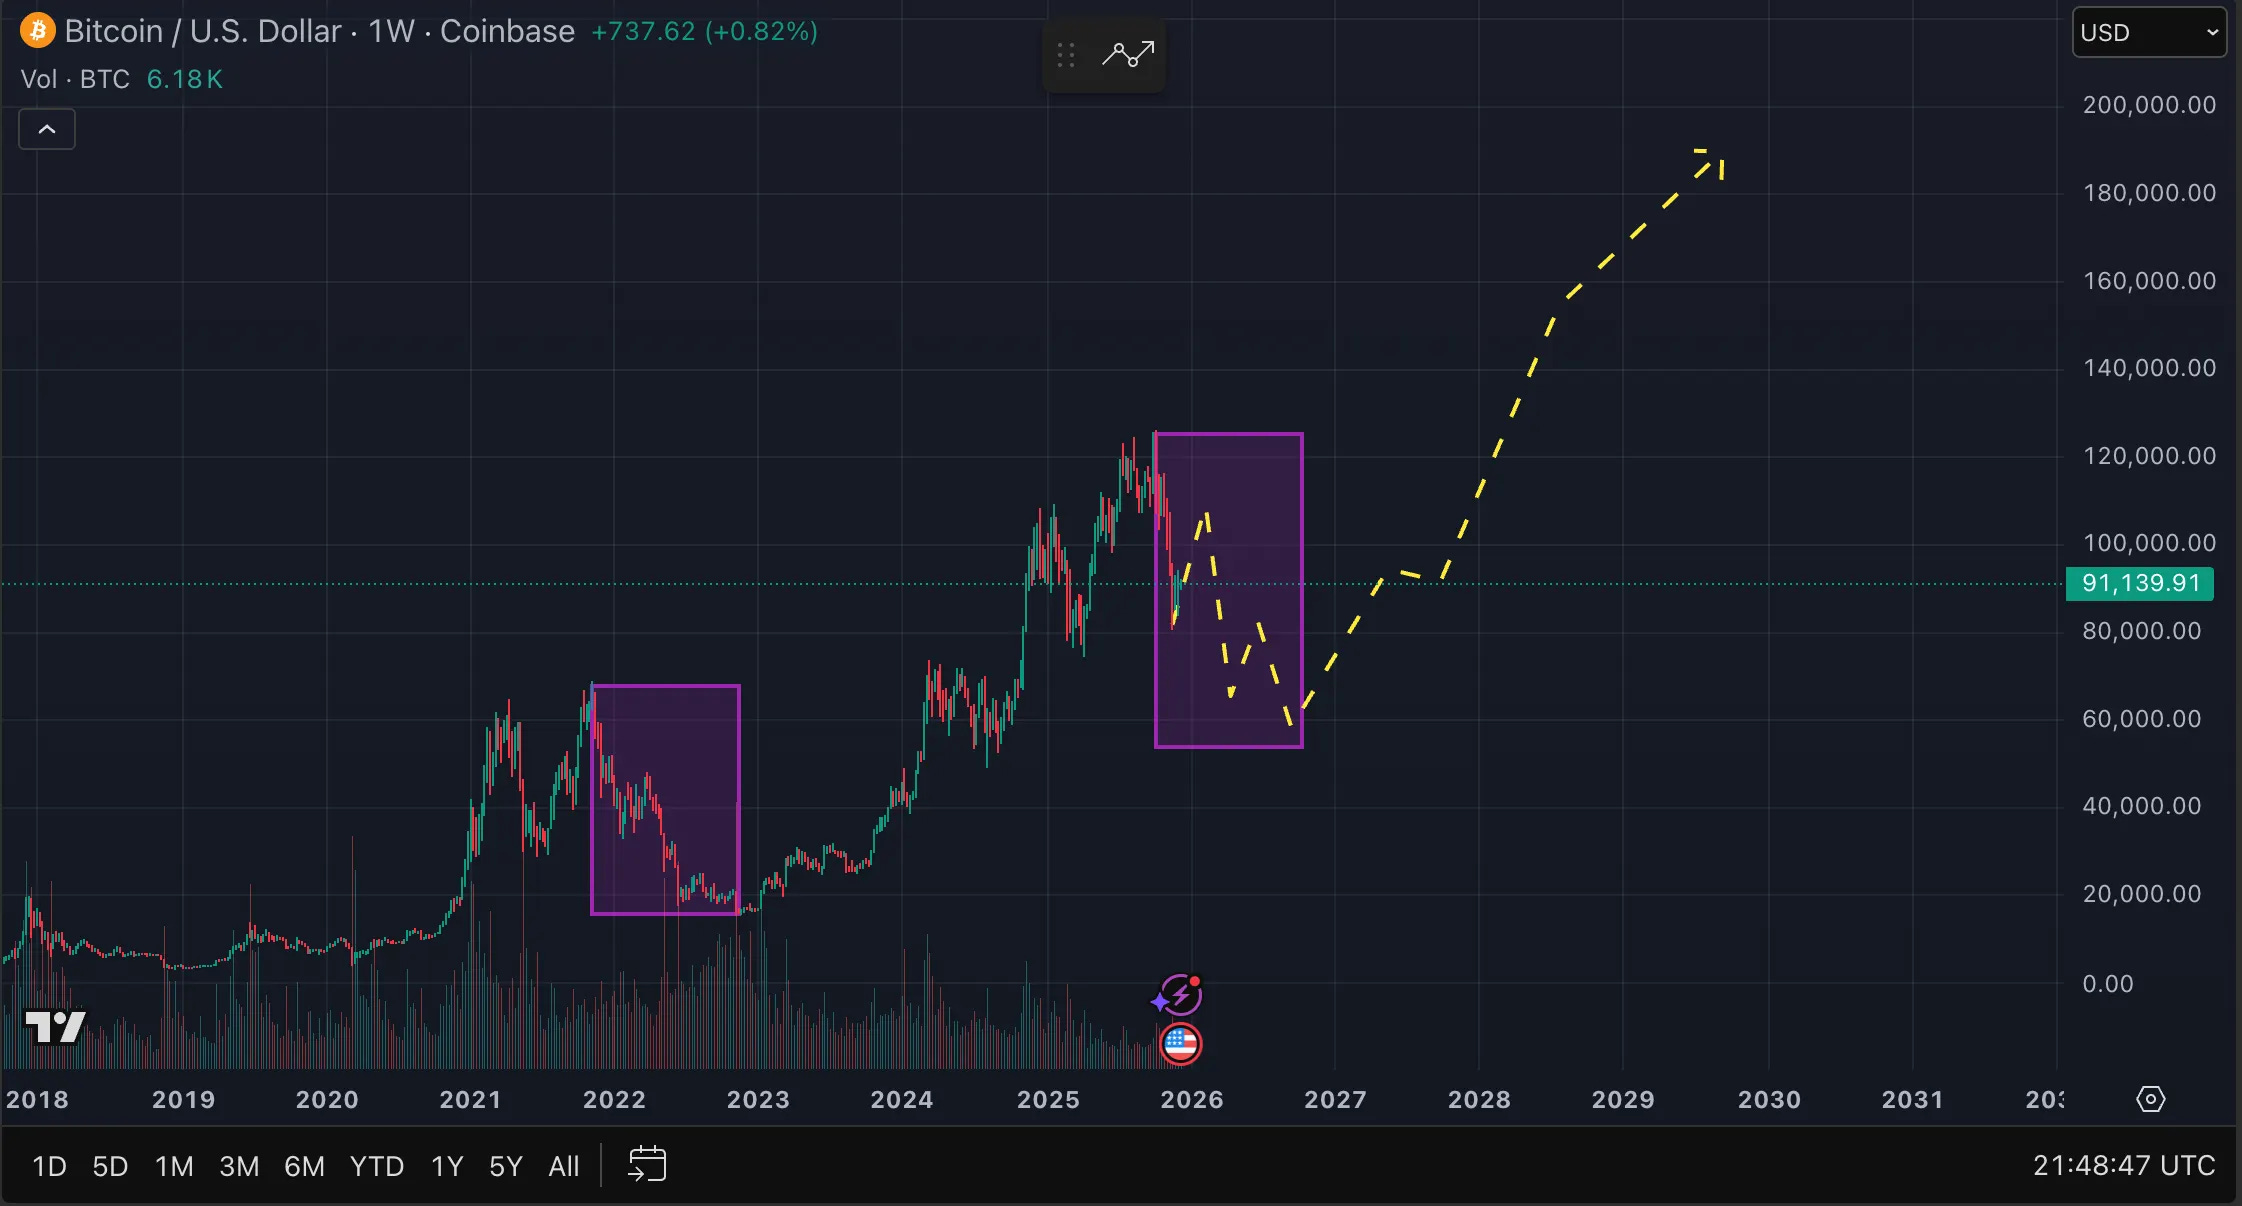
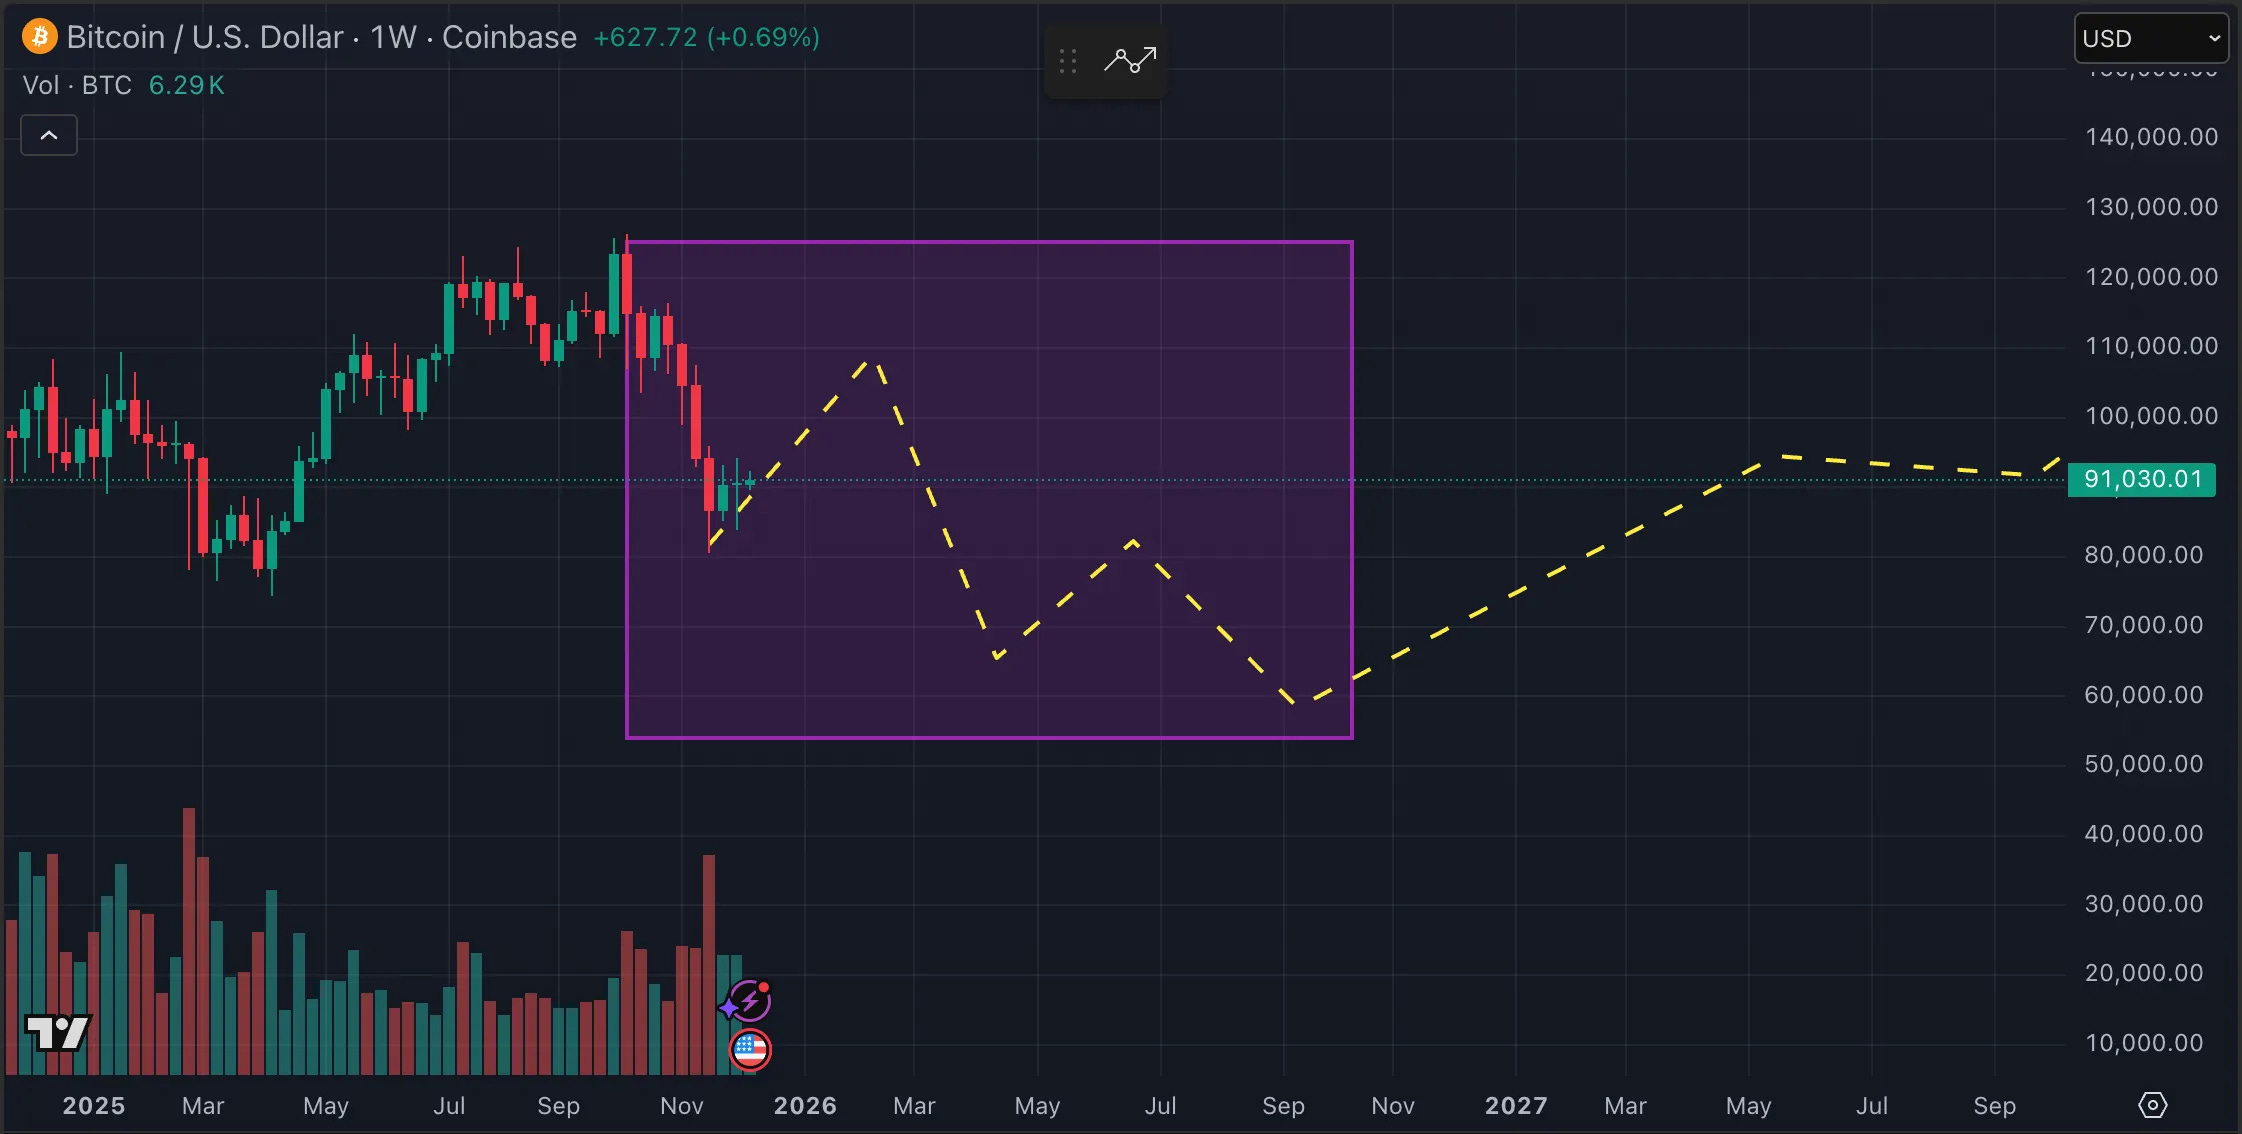
The chart below is my main target and the most important piece of the research on how I predict the market will do its course in the next 4y cycle. 4 year cycle exists but it’s getting smaller eventually transitioning to an S&P alike steady growth dependent on money expansion and BTC network growth Key levels: Current Cycle peak 125k already passed Bear market low - 60k, with brief distortions to downside 50s Next cycle - diminishing bull to 200k
Let’s first examine why we’re even looking at an exponential chart, well there are several reasons for it.
First - Bitcoin is a network and its value follows a power law. Every new person joining acceptance of bitcoin is receiving an opportunity to transact with every other person meaning total value of the network is N(N-1) and follows Metcalf’s Law.
Second - Dollar inflation is real and it’s following compound interest formula making overall inflation exponential as well.
Third - Exponentially diminishing bitcoin inflation.
All three of these points are exponential components of bitcoin price. So overall value of bitcoin is exponential and we can go even further and say that even in the exponential world it’s growing with a non-linear speed. In the beginning the network was growing exponentially faster and now is growing exponentially slower.
Bubbles and price discovery
Why am I calling the theory pendulum - due to similar reflexivity and damping oscillations. Halving gave the industry a drum beat, when halving happens everyone expects returns, cranks up leverage, goes into debt and buys. People know it is a bubble, people know it will go down, they just expect to exit before the others. Decentralized Ponzi scheme operating on a heart beat of 4y.
What follows when the music stops? A massive disappointment, calling Bitcoin dead and fixing the losses, blaming the tech just because someone else has won and you didn’t. Volatility is a feature not a bug, that allowed the industry to grow this explosive way because truly the reason - many people DO want a game like that. Truth be told main crypto marketing - people getting rich quick for no reason. I often wonder what would happen if bitcoin chose not a step function reward halving but a steady smooth decrease, after all it was possible to program any inflation function into the protocol.
Thus main reasons for the bullrun are:
Expectations of a bullrun
Hidden and explicit leverage
You can kinda spot the reflexivity right there in the definition. If it is that simple why hasn’t it been caught yet and stopped being active?
The industry is deeply reflexive in a complex way, when bullrun starts we’re seeing influx of new users, influx of token issuance, increase in volume, lending in DeFi is growing and all fundamental metrics start to look like we’ve finally got underlying asset strength.
Hidden and explicit leverage
While there’s a lot of explicit leverage on exchanges, the past cycle was a perfect example of hidden leverage: Rampant lending between counterparties and unseen operations inside FTX. 3AC had 3b in money lent to it. FTX misappropriated 20B of customer funds into multiple assets running a 5B venture fund alone. Celsius and BlockFi high APY lending. All of it was interconnected.
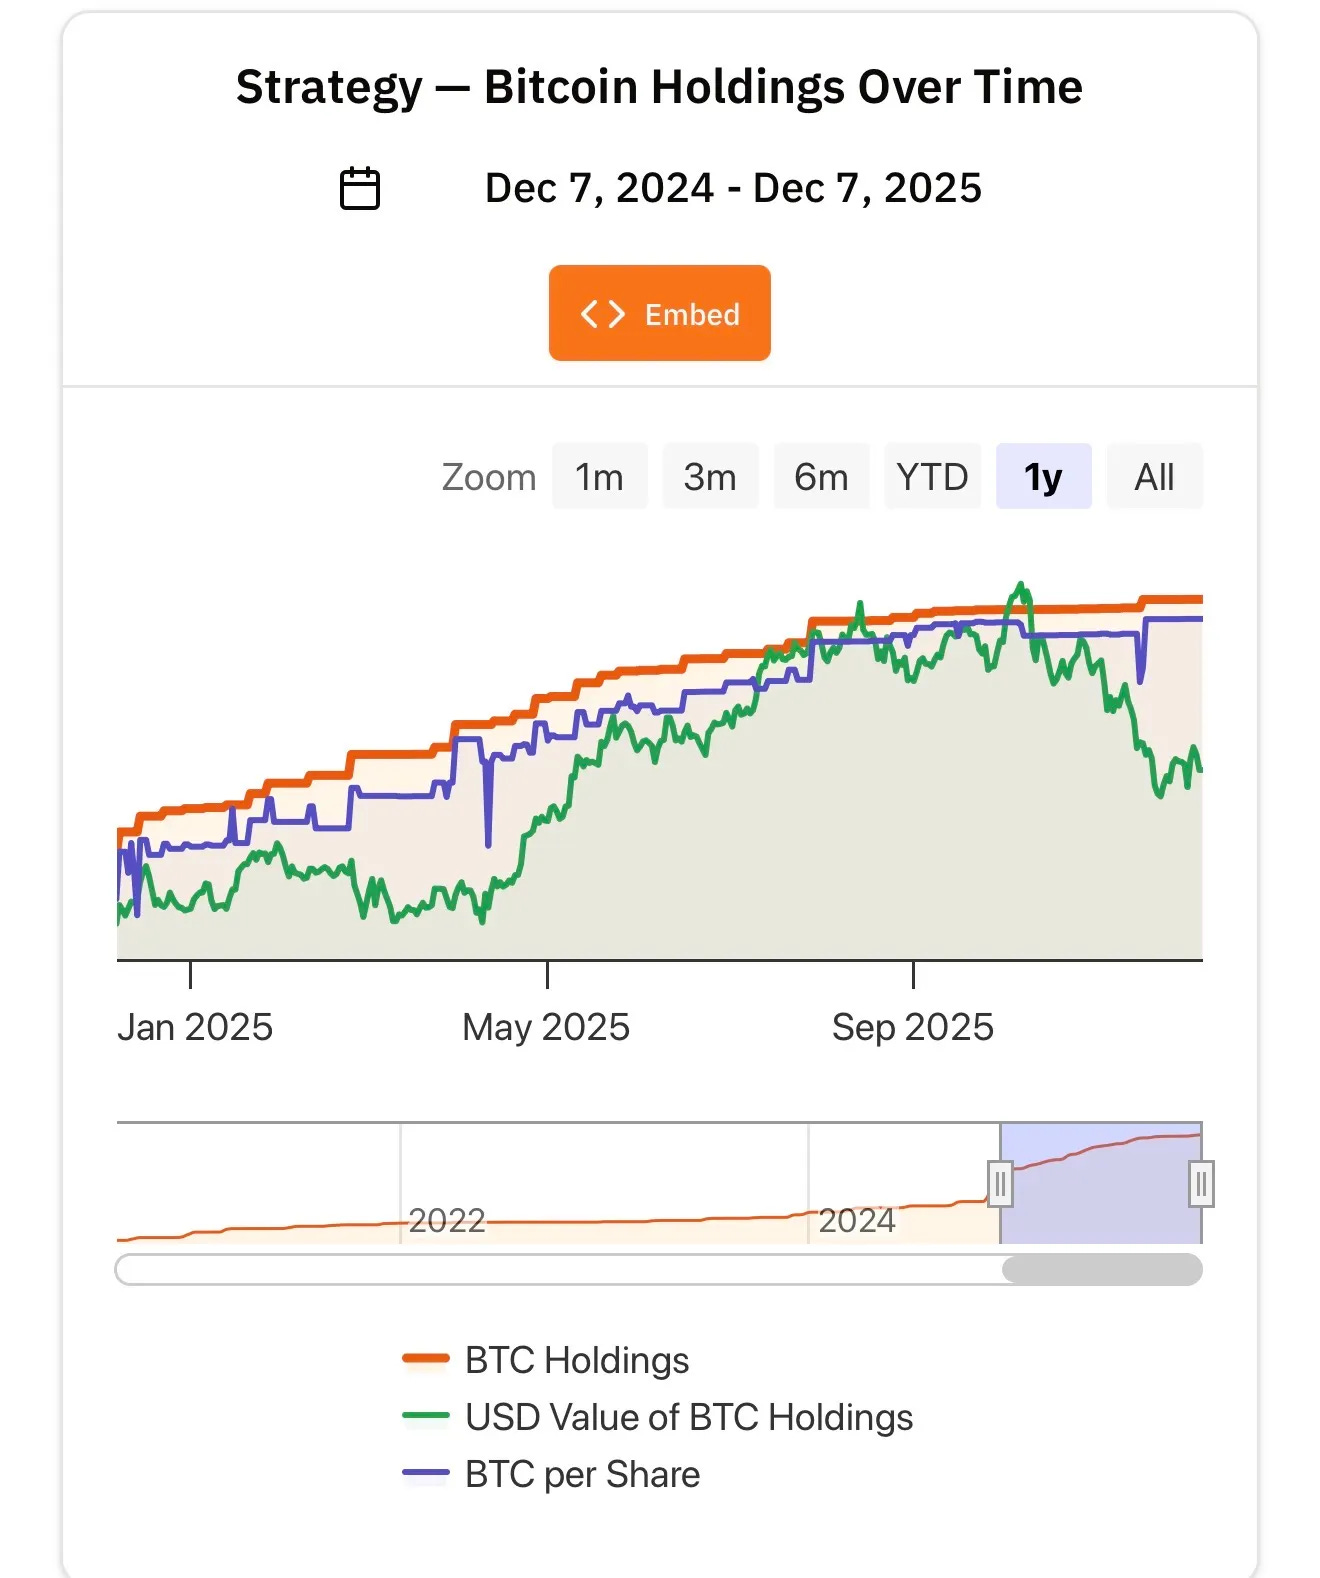
This cycle hidden leverage are DATs. DATs accumulated a record $100B in assets, seemingly run by sophisticated market players but it’s not the case. Why were sophisticated players doing PIPEs into DATs? Because they expected retail to pump the stocks once public. In reddit MSTR is advertised as leveraged Bitcoin bet, why buy just BTC if you can buy MSTR and they will increase your BTC per share with issuance of new stock. Issuance of new stock ATM puts into disadvantage the person who joined the stock last and gives advantage to the participant who joined earlier which is almost a definition of a Ponzi.
Deleveraging
All bubbles operate on the metric of rate of new people joining the frenzy. At some point the velocity of new people drops and we’re seeing the unwinding of the cycle. The main feature of this unwinding is overarching deleveraging with contagion. It happens at the market top and is always sudden and unexpected pop.
Luna collapse triggering 3AC collapse triggering FTX collapse
This cycle we saw the peak of the bubble in September, new DATs and ATM issuance have been announced every day and mNAVs been compressing steadily. Around beginning of Oct all DATs except MSTR had been trading below 1mNAV and stopped buying. China trade talks and rare earth announcement was the last straw.
Oct 10/10 is when this bear market started
The deleveraging feature and $19B liquidations that happened on Oct 10 is my main reason to believe we’re in a bear market. We reached the peak, popped and now seeing slow contagion. The industry got better yes and we’re not seeing dead bodies of huge companies, but the contagion is slow and going from the futures market to the spot. Retail is the key driver for the cycles and retail has been hit hard. Now what do you do when you’re hit hard on futures? You capitulate and liquidate your spot holdings to save yourself. You sell DATs stock, you pull money out burned. You just need the asset to rip to find an exit point. BTC quickly recovered to 115, to get sold more, to get to 100, to recover to 110 to get sold more, to 100 then to 105 to get sold more and finally breaking through the 100k support.
If the theory is right what next?
This is how the earlier exponential chart that honestly looked depressing looks like in a linear scale. Pretty good right?
In the depth of a bear market we will see:
Many DATs unwind. Have to sell assets to support mNAVs
Biggest DATs to face extreme stress questioning their existence, but ultimately withstanding like MSTR
Some political reversal of carte blanche
High US inflation, talks about tightening
External geopolitical event marking the bottom
AI Bubble to pop
Room for optimism and exit opportunities before that
There are multiple short to medium term optimistic points that could play out:
Liquidation maps suggest we have $10B in short liquidations up to $100k from today’s 90k and only $5B in long liquidations to $78k from current 90k
US govt TGA accumulating 1T in assets it couldn’t spend due to shutdown
Market Structure Bill and SEC Crypto Exemption rules
All of those support a pullback up to $100k price level in the next 3 months, mainly fueled by TGA spend up to a point in March when next taxes are due to begin TGA refill marking the next liquidity stress.
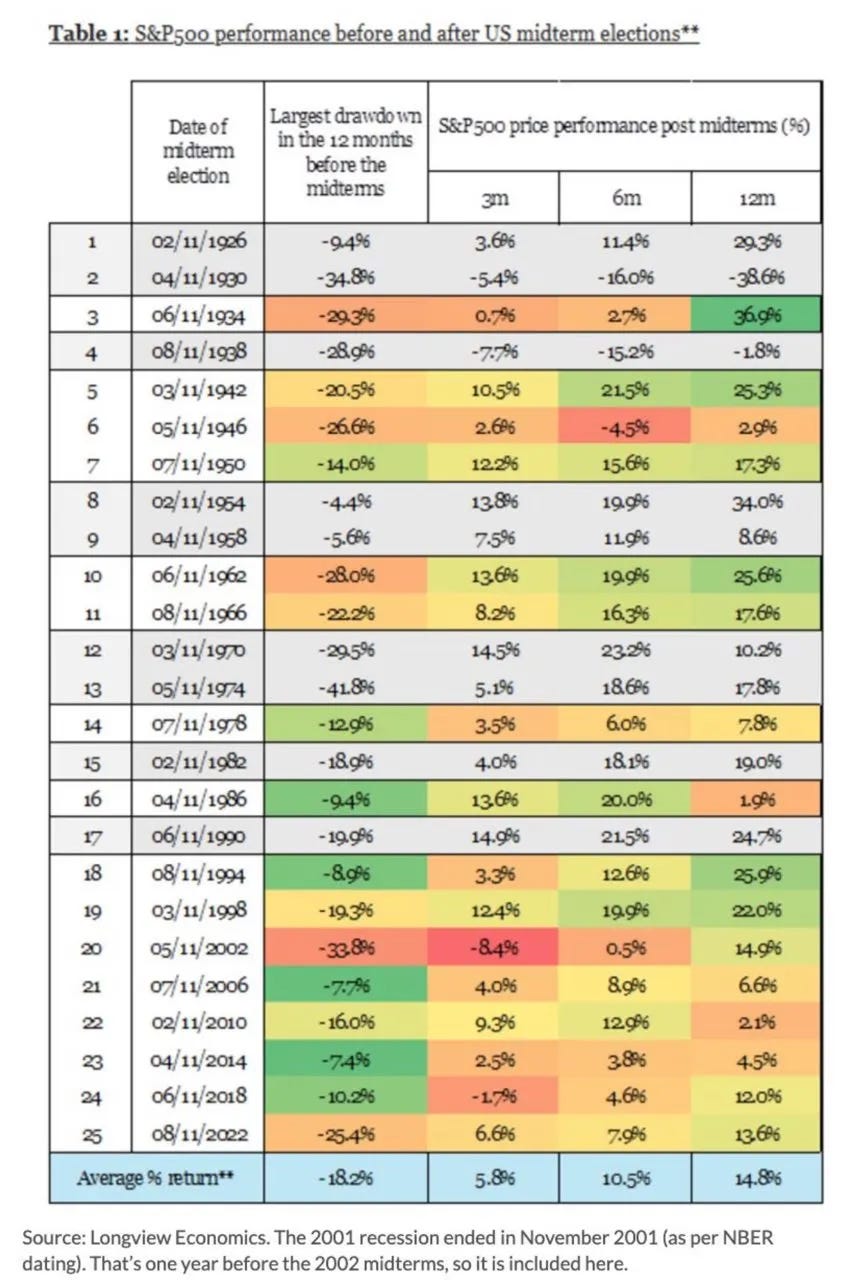
Then we go into Midterms preparation that are historically weakening macro and S&P movements, current projected probability of 77% Democrats taking House will lead to future unwind of Trump bump.
Another correction up during downfall - AI IPOs
Both Anthropic and OpenAI are expected to run IPOs somewhere next year with Anthropic seeming to try to frontrun the OpenAI one and go first. On the back of spectacular AI run those are supposed to do well with OpenAI targeting 1T valuation.
Optimism around both of them since they’re a reason for national glory will definitely draw liquidity support from the government and will boost all risk assets with it.
Then both will start publishing quarterly revenue numbers and the whole world will be reminded of their insane multiples and slower revenue growth that can’t justify trillions in infra spending. That pop will start the final leg of a bear market into the beginning and the first half of 2027. Which would be a great opportunity to buy and a beginning of a new 4y cycle.
Thesis risks
Do we have any external factors that can significantly alter the course of action? There are multiple theories on why this cycle may be different from the others:
Fed pivot and violent debasement trade
Elongated business cycle due to AI Capex boom
No more cycles due to institutional adoption
Let’s review them one by one:
Fed Pivot and violent debasement
Part 1 - Rates
This is probably the main counter argument for the thesis that is likeliest to happen since it stays on point with the core Bitcoin thesis: broken financial system pushes the fed hand into only one available option - real negative yields (high inflation and low fed rate) for an extended period of time to tackle US govt debt crisis. So to rephrase this risk: bitcoin can win too fast.
Lots of price action in 2025 was so called Animal Spirits: violent retail driven appreciation of all sorts of risk assets: Crypto, IPOs, Uranium, Quantum, Meme Stocks. Dollar lost 10% of its value, everything pumped. I dwell on the specificity of cross-sector play here, those sectors aren’t correlated in their fundamentals, but through risk and liquidity.
Trump is pushing hard on interest rates to come down and will soon announce clearly political choice of a Fed chair that will help him fulfill the agenda. That can cause a return of Animal Spirits and continuation of a risk assets rally.
Two things can stop that from happening:
It’s already priced in. Since Trump took office everyone fairly understood what he’s trying to accomplish
Bond market revolt and aggressive yield growth for treasuries
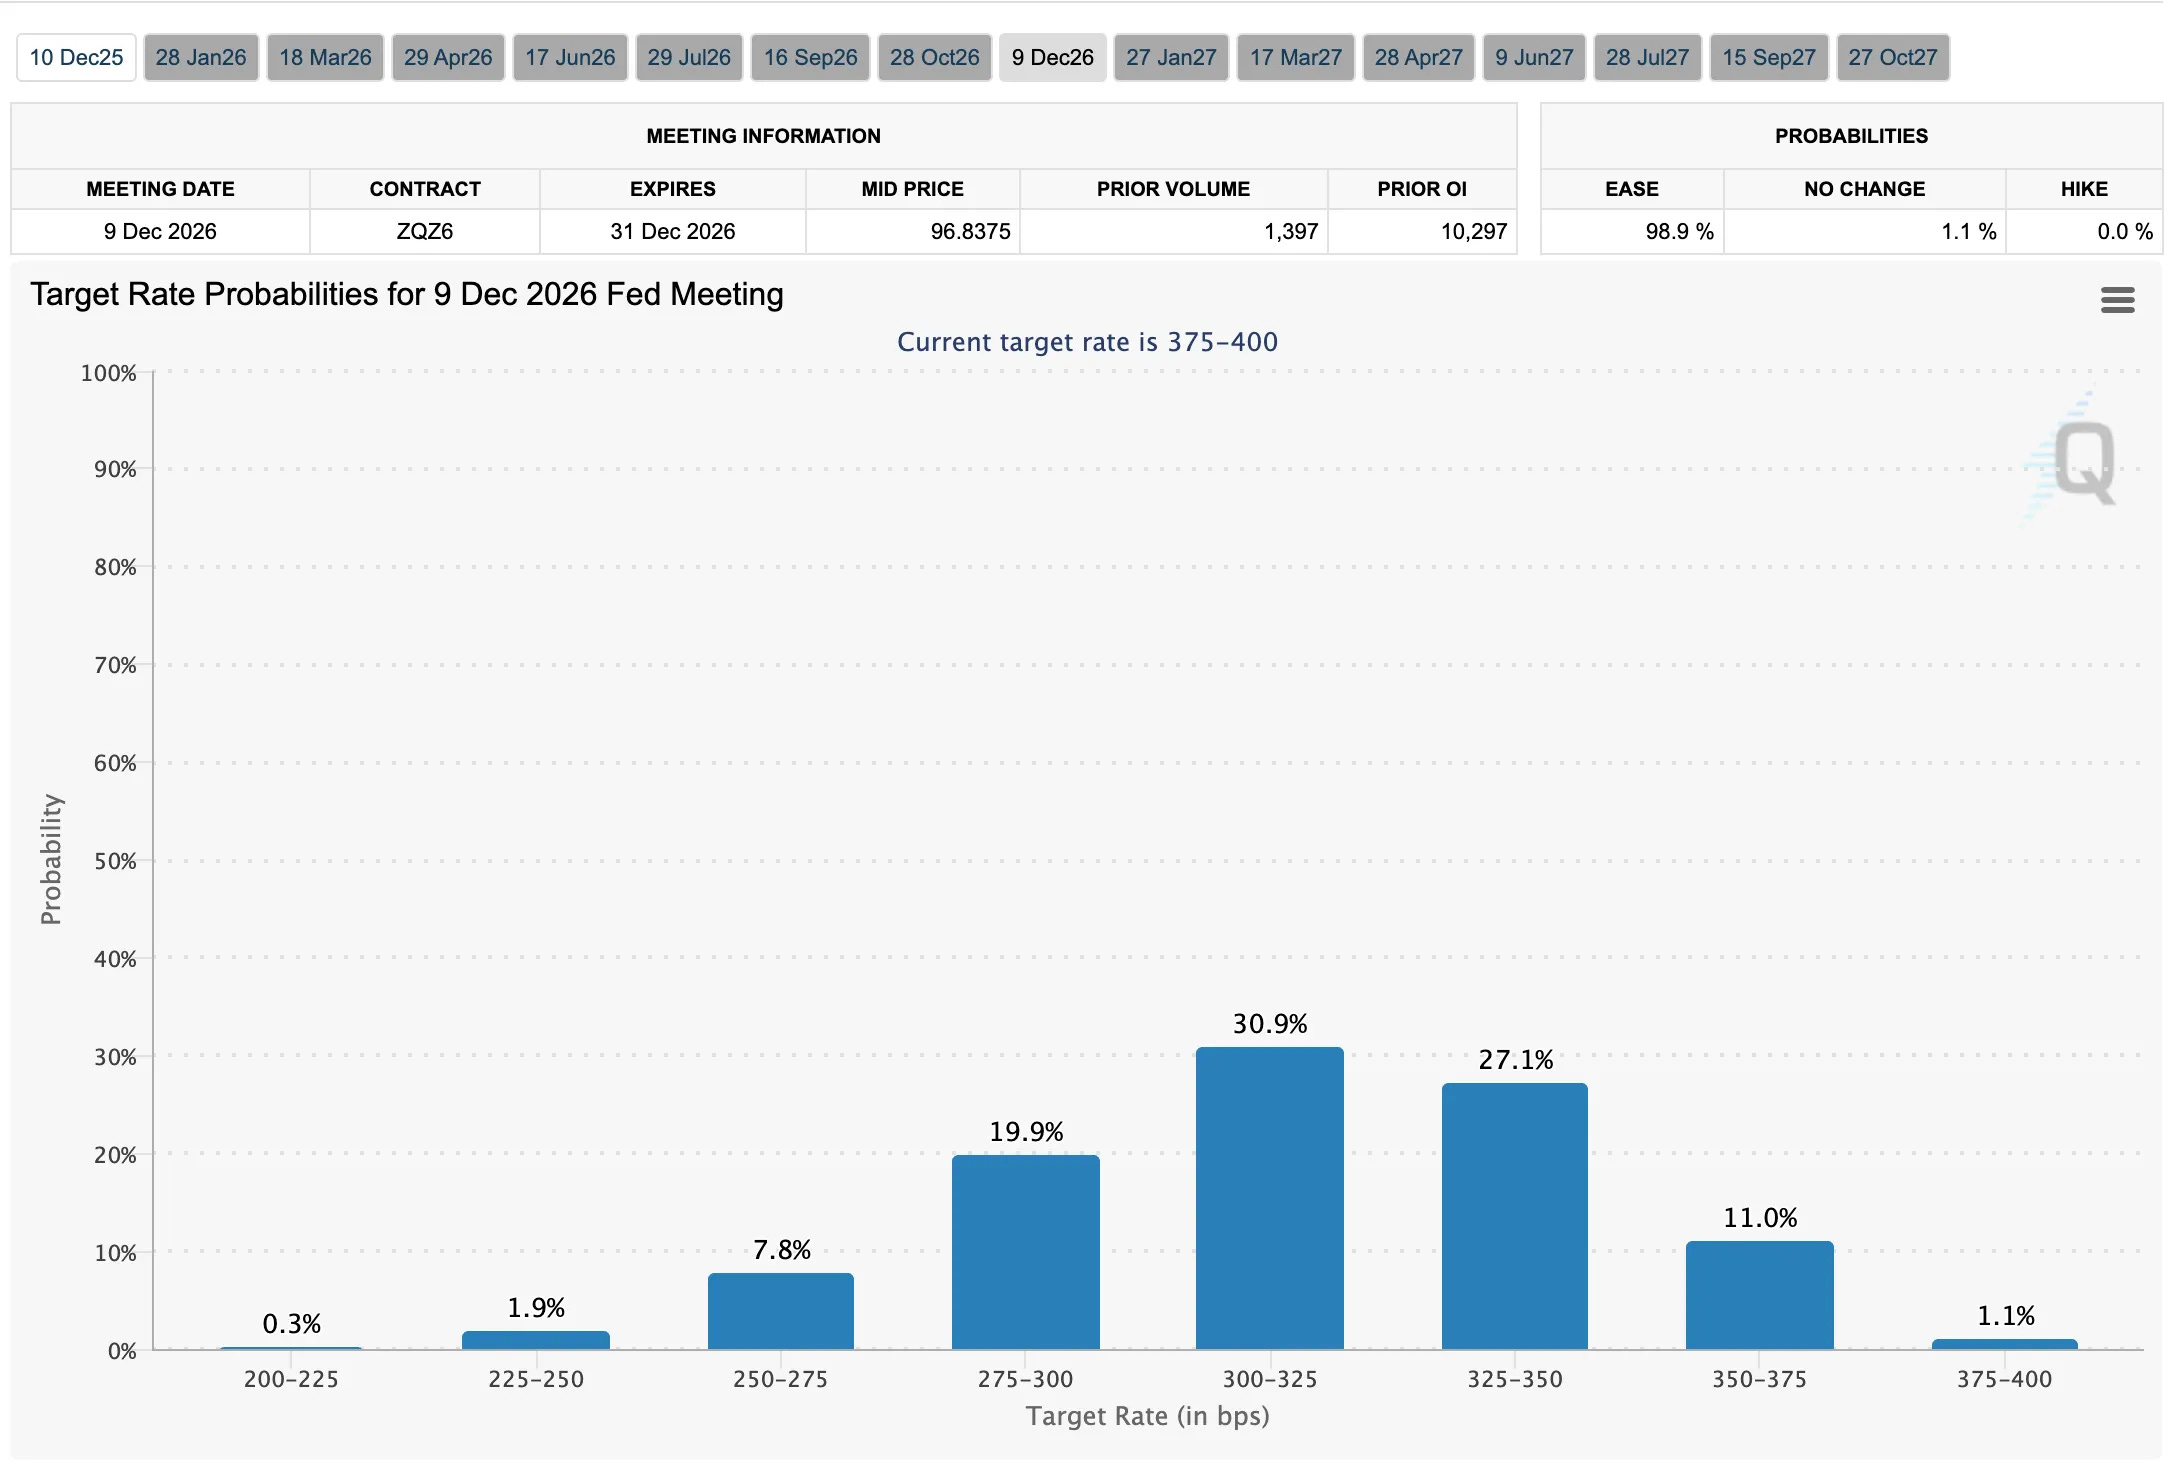
According to fedwatch the market is currently pricing in around slightly north of 3-3.25% as the target rate for the end of 2026, which is just two more rate cuts after the upcoming Dec 10 cut. If the Fed pivots into aggressively more dovish stance the market could still reprice 2 more cuts.
The best read on this I had is from Alex Kruger and can be read here: https://x.com/krugermacro/status/1995874965841645887?s=46
Part 2 - Balance sheet expansion (Not QE, QE)
Another, sometimes even more impactful tool of Fed is balance sheet operations effectively a money emission in case there’s not enough buyers for govt and agency securities fed steps in. Up until Dec fed was running QT - offloading $100B of securities from its balance sheet bloated during covid stimulus times, total amount offloaded - more than $2T, yes T. Now we can say oh my god, the QT ends and massive liquidity drain changes to balance sheet expansion again, that should be incredible for risk assets.
The big hidden factor in this picture is Overnight Reverse Repo facility, effectively another pocket of Fed where excess liquidity can park to earn yield which stored the excess $2.4T at the peak level. Prolonged QT running first depleted this facility effectively not changing the liquidity in the outer system.
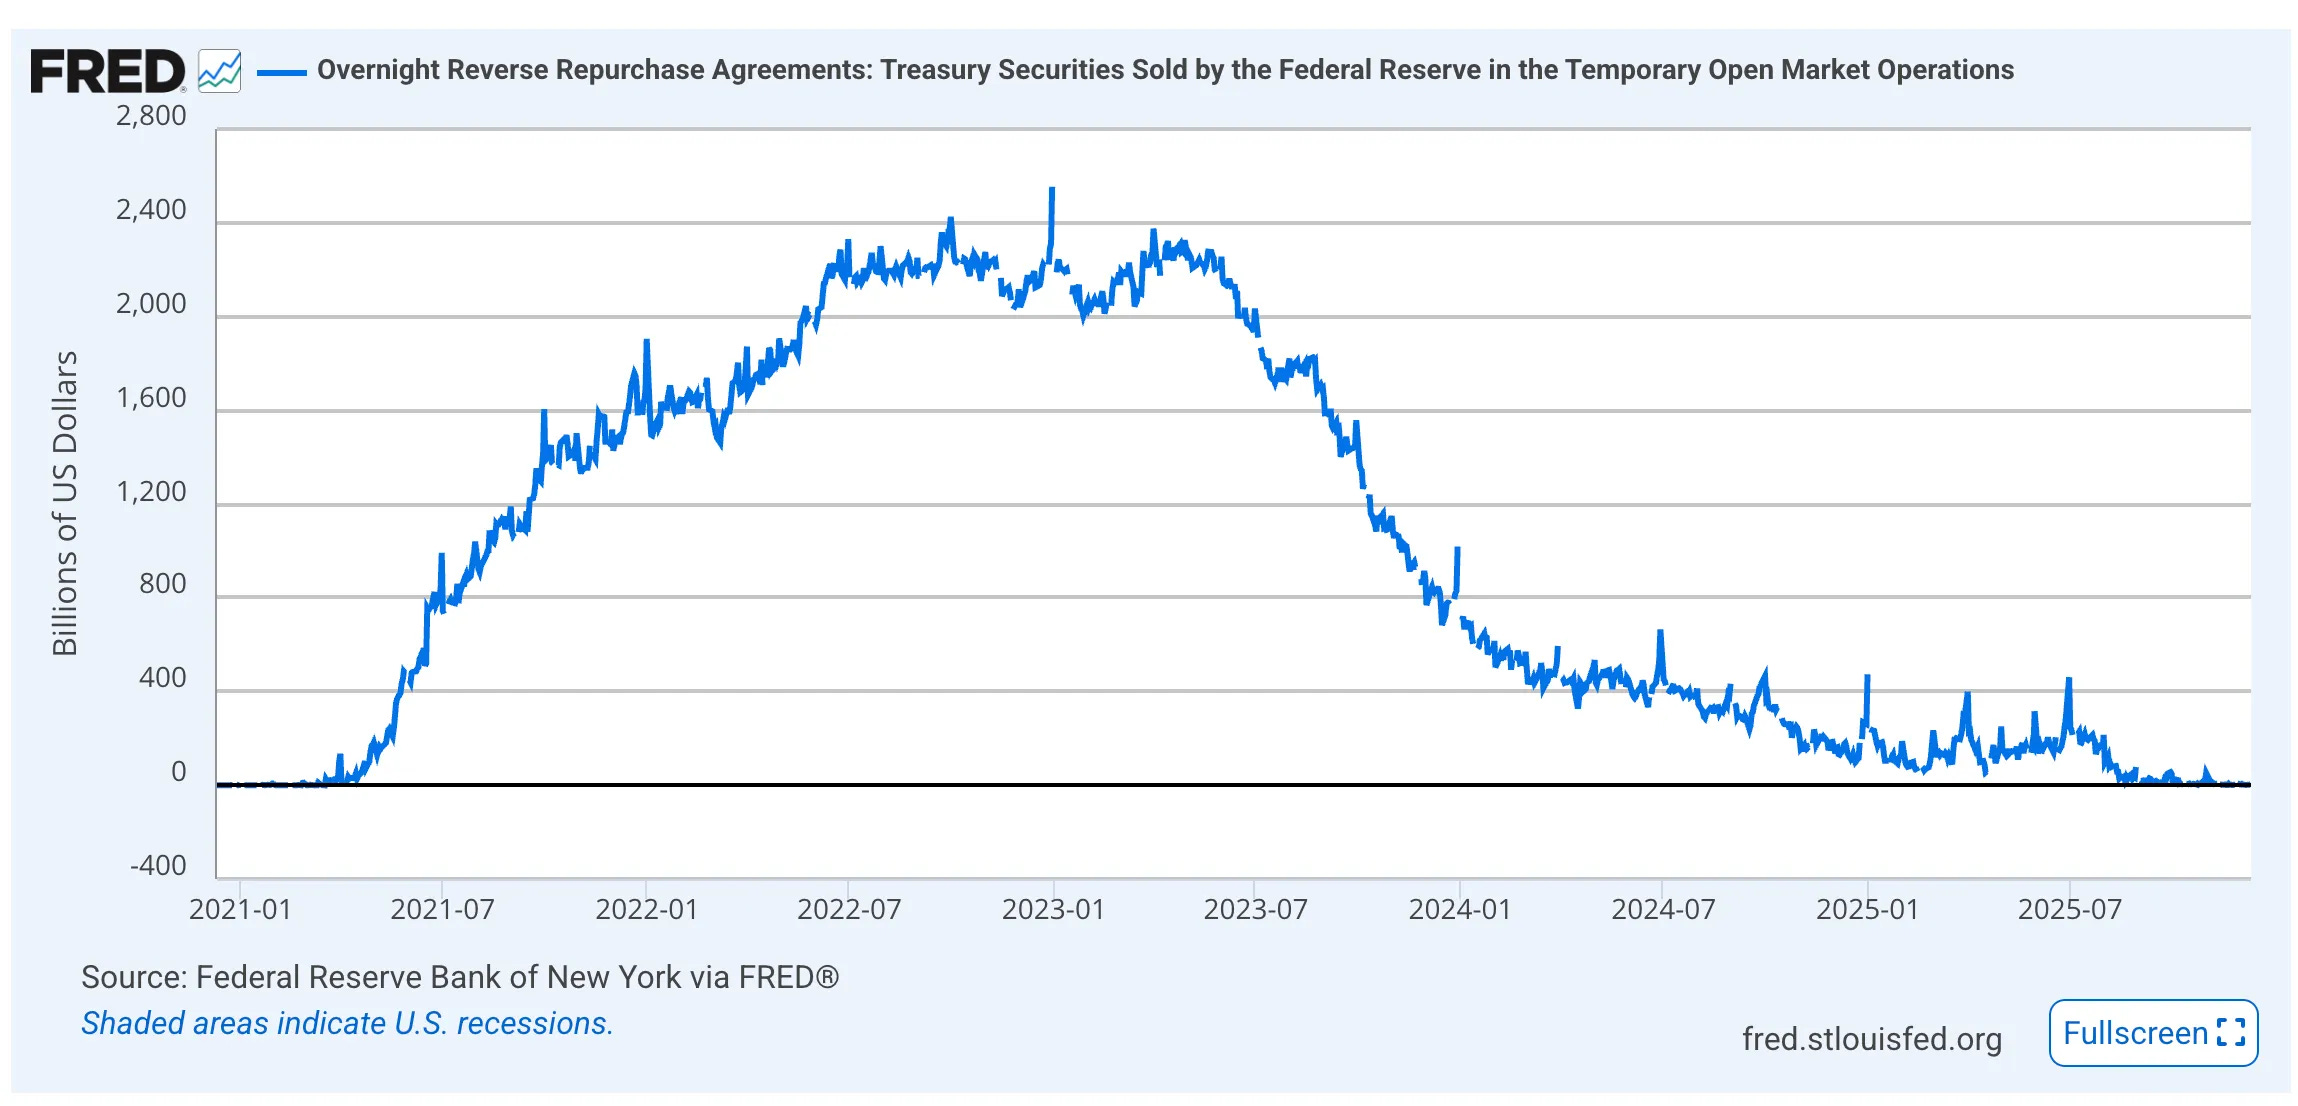
Facility was depleted in August and starting Sept we saw SOFR rates start to climb up and Bank reserves to climb down which is a signal of real liquidity extraction from the system. Since Aug fed balance sheet reduction accounted for about $500-600B and bank reserves dropped $300B - real effect of QT.
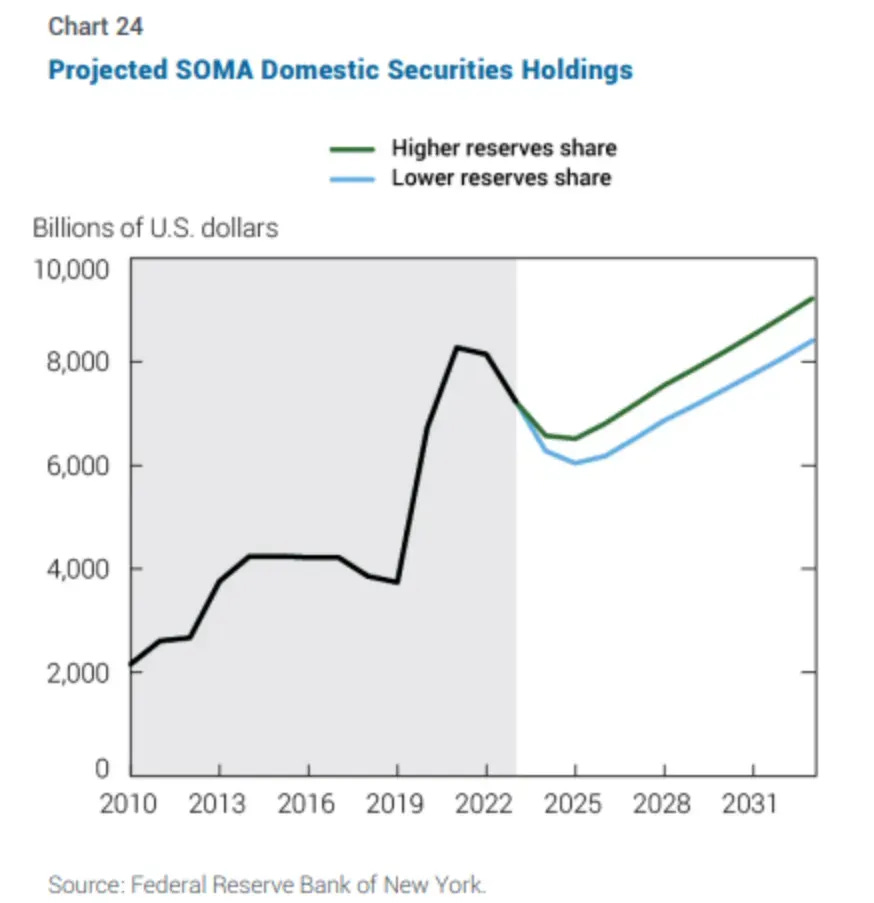
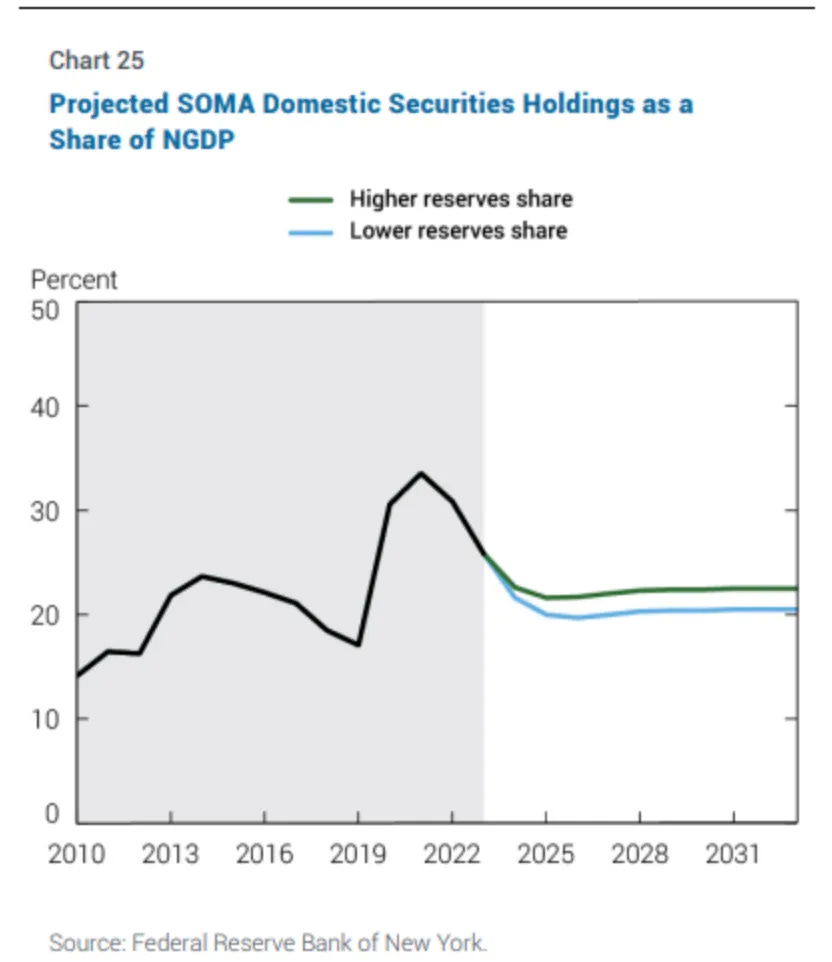
On Dec 10 meeting Fed has announced temporary $40B a month balance sheet expansion to prepare for April 15 tax season and then returning to target of $20B a month balance sheet expansion. This is not comparable with trillions of 2021 covid balance sheet expansion. Here below are the charts for proposed balance sheet expansion in the next 6 years. Most notable is a second chart - balance sheet share of Nominal GDP - effectively fed says they will keep balance sheet flat as a share of GDP, which is reasonable and as it should be, fed doing its plumbing work for GDP growth.
To sum up - fed isn’t expected to do money printer goes brrr and just wants economy to run its course. Unless again a massive pivot from the new Fed chair.
I take this risk seriously as the main counter thesis for 4y cycle.
AI Boom
I have the least amount of knowledge about this part so approaching this carefully. AI boom is fueling the economy and massive capex spending with all projections now totaling $1.5T in datacenter construction is a massive driver. There’s a common risk in this spending which is unsubstantiated AI revenues, OpenAI revenue for example still sits at around 20B which brings concerns to the market. We’re seeing early cracks in the story with datacenter bonds CDSs starting to spike. All in all I see this sector as exacerbating future bear market rather than countering it as OpenAI and Anthropic targeting IPOs in 2026. IPO season is usually the peak of the market with disillusionment following when companies start to publish quarterly reports. We can expect end of 2026 and beginning of 2027 as AI bubble unraveling which is perfect timing with crypto bear market. Will it mean that crypto will continue to rise in 2026 and hit new ATHs? I don’t think so, we’re seeing crypto to decouple from S&P in the latest couple months showing that internal crypto related downward pressure overstates the global S&P positivity. S&P had a correction and now correction is over, it’s back to ATH while crypto is still 25% down. We can expect crypto to softly rise on S&P moving up and crypto going twice as hard down on S&P weaknesses.
No more cycles due to institutional adoption
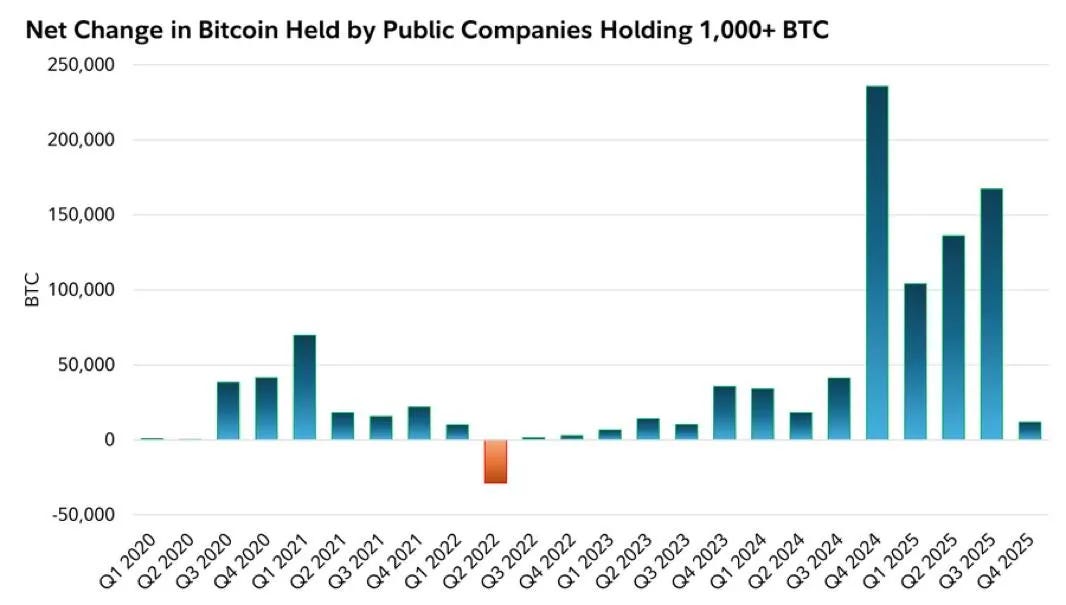
There’s a clear trend on the institutional adoption coming both from the adoption of ETFs as well as regulatory clarity. One telling point is low ETF outflow rate, about 5% with the recent 30% market plunge. What if the main market participants just buy and hold?
I see this risk as the fundamental reason why pendulum will stop at some point and converge to a global macro S&P style growth for Bitcoin and the reason why the range on the exponential chart is shrinking.
Why I’m not thinking this is yet true? The overall ETF inflows are still relatively low, sitting at $60B which is still lower than total DATs accumulations of around $100B that are mainly retail driven.
Additional reads and materials
https://www.lynalden.com/december-2025-newsletter/
https://x.com/ramahluwalia/status/1997499964356702302?s=46
https://x.com/milkroadmacro/status/1997357889833652724?s=46
https://x.com/jameseastonuk/status/1997252175764893818?s=46
https://bitcointreasuries.net/public-companies/microstrategy